From the Wall Street Journal, 9/26/18, New York City Comptroller Admits Error on Housing Report
New York City’s top fiscal officer issued a mea culpa on Wednesday for a major calculation mistake in a report on the rapid decrease of affordable housing.
Comptroller Scott Stringer’s report, “The Gap is Still Growing,” this month stated that the city lost more than 1 million apartments renting for $900 or less between 2005 and 2017. But the actual number is less than half of that: 425,492 houses, according to the updated report.
Indeed, the dramatic number drew much coverage, and the math error is a big one. Though the conclusions in "The Gap is Still Growing: New York City’s Continuing Housing Affordability Challenge," must change somewhat, the report is still pretty damning.
That lack of affordability is part of why some supported Atlantic Yards/Pacific Park and others argue for more density above all. And why Borough President Eric Adams argues for more monitoring,
Not only do our rent regulation laws need real overhaul, but it’s past time that government have a CompStat for #affordablehousing. Too much falls through the cracks of bureaucracy. We learn about our hemorrhaging of affordable units too late to save them. https://t.co/ZiGywn5ke1— Eric Adams (@BPEricAdams) September 25, 2018
The big picture: losing ground
The introduction:
In April 2014, the Office of New York City Comptroller Scott M. Stringer published The Growing Gap: New York City’s Housing Affordability Challenge. Reviewing census bureau data, The Growing Gap documented a substantial shift in the cost of housing in New York City between 2000 and 2012. During that period, more than 400,000 apartments renting for less than $1,000 disappeared from the inventory, as median rents were pushed higher by 75 percent.(Emphases added)
The new update initially suggested that the challenge had "accelerated," while the revision says it has "continued." Bottom line: "the City’s lowest-income households [still have] with fewer and fewer options for affordable housing."
All rent and income figures in this report are adjusted for inflation and expressed in constant 2017 dollars.
How many units?
The initial report:
Between 2005 and 2017, rising rents led to the disappearance of 1.069 million apartments renting for $900 or less (in 2017 dollars) from the City’s housing inventory. The largest share of these units – 40 percent, or 428,000 apartments – saw their rents increase to between $1,051 and $1,500. Apartments renting for over $2,700 per month increased by approximately 238,000 units (Fig. 1).
The revision:
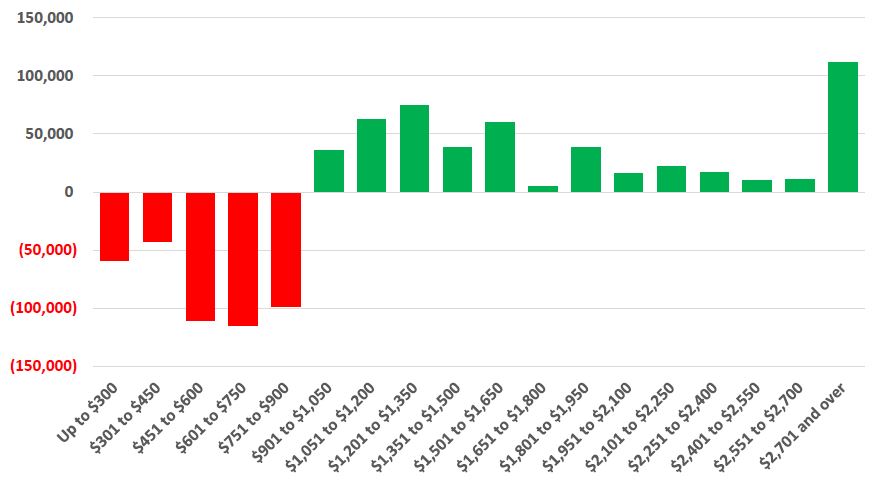
Between 2005 and 2017, rising rents led to the disappearance of over 425,000 apartments renting for $900 or less (in 2017 dollars) from the City’s housing inventory. Over half of these units – 55 percent, or more than 235,000 apartments – saw their rents increase to between $1,051 and $1,650. Apartments renting for over $2,700 per month more than doubled, increasing by approximately 111,000 units (Fig. 1).
This substantial shift in the price distribution of rental apartments away from lower-priced units, to more middle- and high-rent units is illustrated in Fig. 2.
The initial report:
In 2005, 87.5% of rental apartments in NYC rented for $1,200 or less. By 2017, just 41 percent of apartments rented for that amount. Meanwhile, the number of apartments renting for more than $2,700 per month shot up from just 2.7 percent of the inventory, to 13.9 percent of all apartments. This rise in housing costs was seen across all five boroughs, although Manhattan was the only borough with a loss of low-cost rental units that exceeded its gain of higher-cost rental units.
The revision:
In 2005, 78.4 percent of rental apartments in NYC rented for $1,200 or less. By 2017, just 60 percent of apartments rented for that amount. Meanwhile, the number of apartments renting for more than $2,700 per month shot up from just 3.9 percent of the inventory, to 9.0 percent of all apartments. This rise in housing costs was seen across all five boroughs, although Manhattan was the only borough with a loss of low-cost rental units that exceeded its gain of higher-cost rental units.
 |
| Initial version |
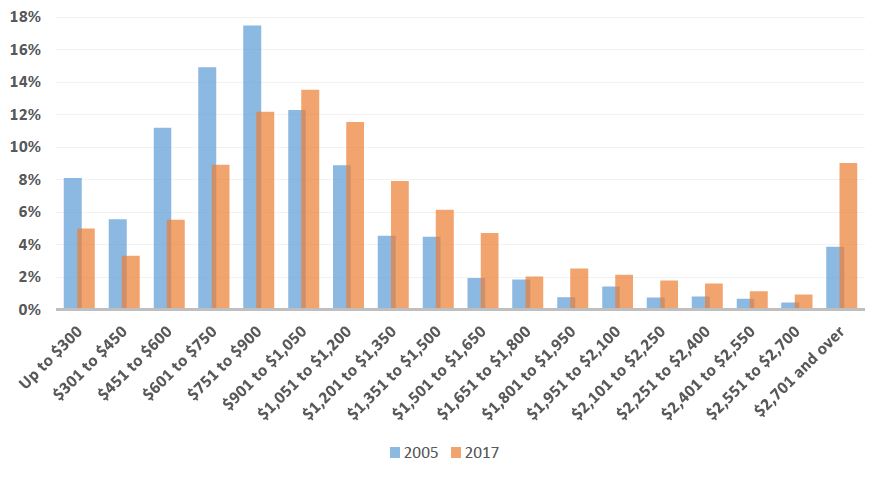 |
| Updated version (note different vertical metrics) |
The impact of population growth, and empty apartments
From the report:
One factor that may have contributed to the rising cost of housing is that the supply of housing has failed to keep up with the continuing growth in the City’s population. Between 2005 and 2016, the City added an estimated 576,000 residents – but a mere 76,211 net new units of occupied rental housing. Between 2011 and 2017, the number of occupied rental units actually declined (insignificantly – 942 units), while the total available rental inventory (both occupied and unoccupied units) rose by a mere 0.5% or 10,430 units.
In contrast, the number of unavailable units rose by 51%, from 164,467 in 2011 to 247,977 in 2017. The most common reasons apartments were considered not available was that they were awaiting or undergoing renovation (32 percent of unavailable units) or were held for occasional, seasonal, or recreational use (30.5 percent of unavailable units).
That's a huge number of unavailable units, with some 75,633 unavailable because they're second homes or pied a terres. That wouldn't necessarily solve the crisis, but it sure would help. And yes, we need more supply.
The report cites "a continued erosion" in the availability of rent-regulated housing, including rent-stabilized, rent-controlled, and Mitchell-Lama rental units, which comprise the majority of units renting for between $601 and $1,800, as shown in the graphic below.
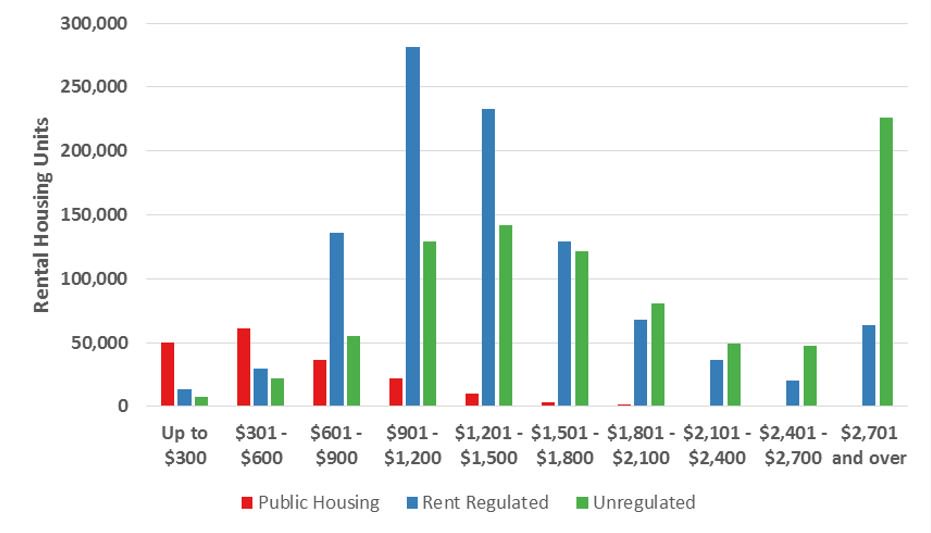
Note the not insignificant chunk of more expensive rent-regulated housing, which include rent-stabilized units (like those at Atlantic Yards) gaining the 421-a tax break, even if they're relatively costly.
New York City lost 88,518 units of rent-regulated housing between 2005 and 2017, which more than all the new construction
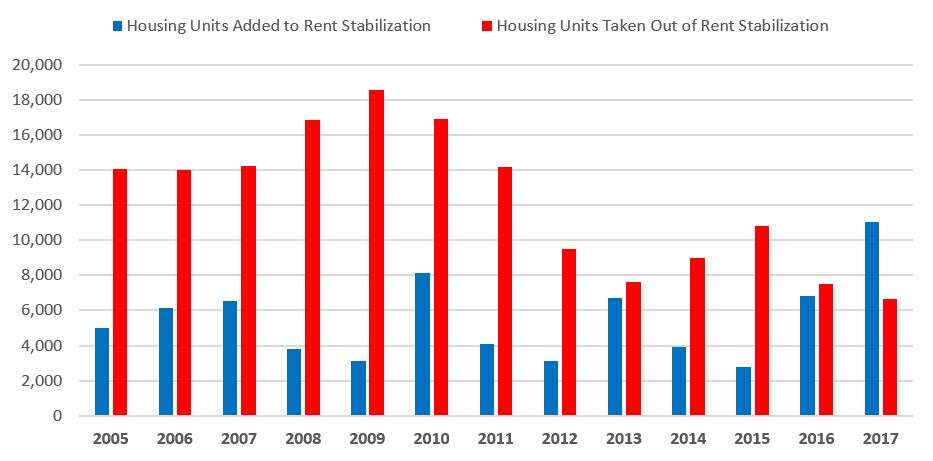
From the report:
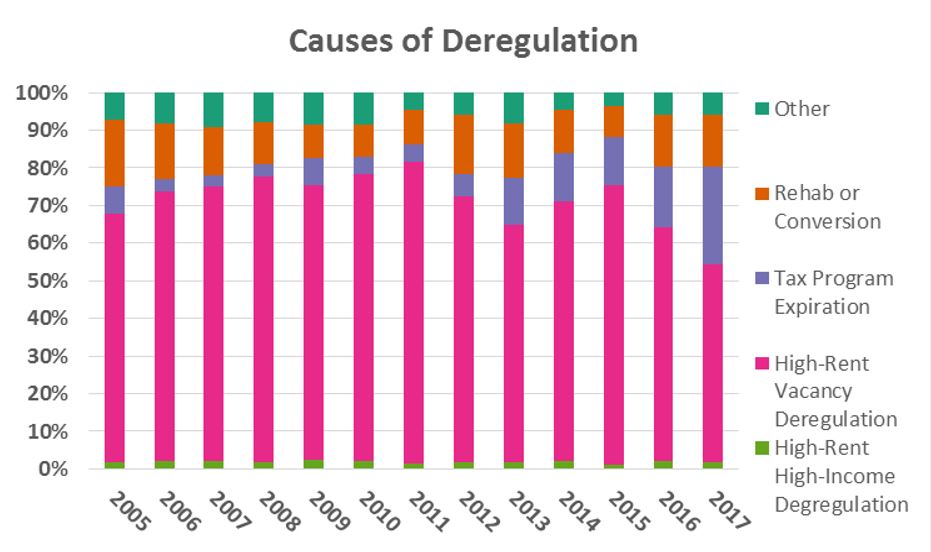
High-rent vacancy deregulation, under which a unit can exit rent stabilization when a tenant chooses not to renew their lease and if that unit’s maximum legal rent exceeds a deregulation threshold set by the State, was by far the biggest contributor to the loss of rent-stabilized housing during this period, as show in Fig. 5. But higher deregulation thresholds enacted in 2011 and 2015 may have contributed to noticeable dips in the number and share of deregulated units attributable to high-rent vacancy deregulation in the years immediately following passage.
The increased threshold for high-rent vacancy decontrol, which rose from $2,000 to $2,500 in 2011, and to $2,700 in 2015, may also explain why three-quarters of units renting for over $2,700 were unregulated in 2017, up from 60 percent in 2005, as owners of rent stabilized units chase increasingly rising decontrol thresholds.
Another subtraction
A section regarding public housing and vouchers was cut from the updated report. From the original:
But as housing prices have risen, real (constant 2017 dollars) out-of-pocket rents increased substantially from 2005 to 2017. In 2005, 9 percent of [Section 8] voucher holders paid out-of-pocket rent of more than $600 – a figure that had grown to 25% by 2017. The problem is that rent growth outpaced income growth among voucher holders by a rate of 3-to-1, with voucher holders’ average contract rents increasing by 29.9 percent, while their average household incomes rose by just 8.7 percent, from $22,246 to $24,175.Presumably, those numbers are no longer valid.

Comments
Post a Comment