In a memorandum dated December 14 but released yesterday, the Empire State Development Corporation purports to offer “a more complete description” of the economic analysis that led to a drastic drop of $456 million in net projected Atlantic Yards revenue, but the agency leaves numerous questions unanswered.
Notably, the memo does not explain why the agency changed its methodology in projecting a more than fivefold leap in city tax revenues from construction (even as the total tax revenue plummeted) nor a significant discrepancy between the revenues in the memo and in the General Project Plan (GPP).
Also, it doesn't explain why the ESDC changed the discount rate--the interest rate used in calculating the present value of expected benefits and costs—from 6% to 3%. (Given that a higher discount rate means a smaller present value of future cash flows, lowering the discount rate would increase the present value, perhaps overinflating even the lowered revenue figures the ESDC released this week.)
 Nor does the memo explain why the ESDC corrected some apparent errors in the previous memo, issued October 18, including an agency assertion that “25% of visiting team players salaries is earned in New York City.” (There are 30 teams in the National Basketball Association.)
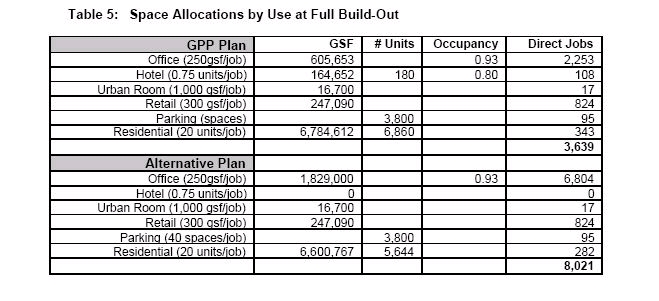
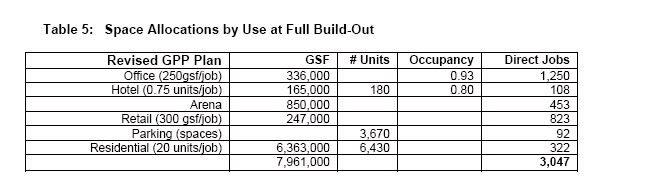
[Note: the first graphic of each pair is from the October memo; the second graphic is from the December memo. Click to enlarge. Emphases in text are added.]
Inadequate transparency
 I shared the document with Dan Steinberg, research analyst of Good Jobs New York, which monitors economic development subsidies. He called it “a flimsy, last-minute attempt to address the transparency concerns that have been raised by the public and many elected officials. I’ve always had trouble getting information out of ESDC in this administration. We still don’t really understand where many of these numbers come from."
Similar, but different
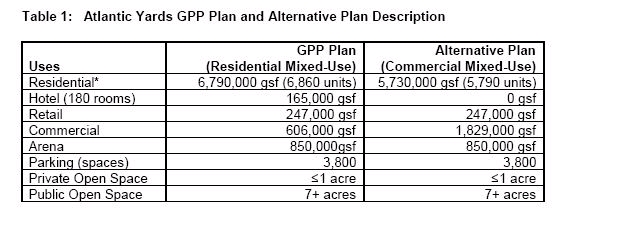
The memo mirrors the document issued 10/18/06 in response to pressure from the press, politicians, and community members. The new memo reflects an 8% reduction in the square footage of the project, including a 44.5% cut in office space.
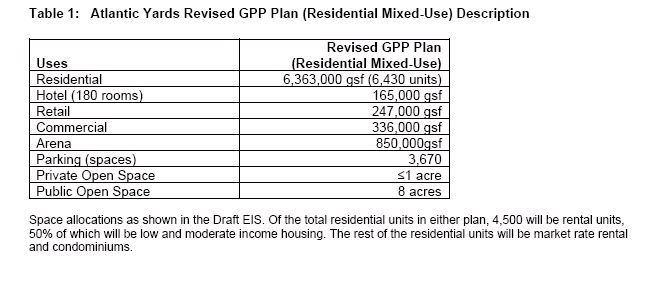
 Little is changed in the initial part of the memo, though Table 1, which describes the Atlantic Yards Revised GPP Plan (Residential Mixed-Use version) neglects, unlike in the October memo, to include an alternative plan with more office space.
(Why not? More office space would accommodate more jobs and return more taxes to the city and state. Does the ESDC no longer consider the alternate plan realistic? Or would the contrast in revenues--because office space generates more spinoff jobs and thus tax receipts--be even more dramatic?)
Construction impacts confusing
However, there are dramatic differences between the two versions of Table 2, which presents the estimated one-time construction economic and fiscal impacts of the overall project.
The new memo estimates 12,568 direct jobs—actually job-years—down from 15,344 in the October memo. There’s no explanation, however, about the reason for the 18% drop, which is not commensurate with the 8% reduction in the project’s size.
 More confusingly, the ESDC in the memo estimates $291.9 million in city tax revenues, a distinct contrast with the $52.5 million figure in the October version. The latest memo adds that “the New York City tax revenue total from construction activity is inclusive of the MTA portion of tax revenues,” but it doesn’t explain how that changes the calculation. By contrast, the newly revised General Project Plan states that construction employment will generate $42.1 million in city tax revenues, which sounds like a commensurate reduction from the October figure.
The October memo states:
Total personal income earned by direct, indirect, and induced construction-related wage earners is estimated to be $1.1 billion in New York City and $1.5 billion in New York State (inclusive of New York City). Tax revenue collected by New York City as a result of construction-related activity and employment is estimated to be $50.5 million and $109.5 million for New York State.
The December memo states:
Total personal income earned by direct, indirect, and induced construction-related wage earners is estimated to be $903 million in New York City and $1.2 billion in New York State (inclusive of New York City). Tax revenue collected by New York City as a result of construction-related activity and employment is estimated to be $291.9 million and $169.4 million for New York State.
 Steinberg observed, "The fact that there are discrepancies between this and the GPP (right; item iii) makes it difficult to understand what they’re saying at all.”
Impact from permanent jobs
In Table 3, the agency in the December memo estimates tax revenues from permanent jobs at the project. Again, the memo presents only the residential mixed-use version, rather than the alternative plan, with more office space.
 In the October memo, by contrast, the agency presents both versions, with the alternative plan estimated to provide more than double the tax revenues.
Given the significant decline in projected tax revenues, the contrast between the two versions would be even more glaring. Again, the ESDC changed from a 6% discount rate to a 3% discount rate, which could boost estimated revenue, without explaining why.
Summary of assumptions
The ESDC explains that it has used the REMI model (Regional Economic Models, Inc.) of the New York City region: “REMI tax revenue estimates reported here reflect a broad set of state and local tax collections including personal income tax, corporate and business income tax, sales tax, property tax, and miscellaneous other taxes.”
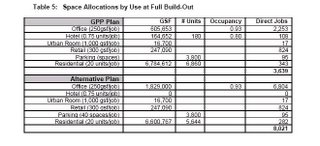
 Confoundingly, both versions of the memo, which skips from Table 3 to Table 5, neglect to explain where in the model the ESDC factors in taxes on” taxable ticket, concessions, and novelties sales at the arena” and effects from the players’ earnings and consumption spending.
Player salaries
The ESDC assumes, as did Forest City Ratner consultant Andrew Zimbalist, that “30% of Nets players live in New York City and pay both City and State personal income tax.” Still, it’s not clear whether that's a realistic assumption.
The October memo states:
25% of visiting team players’ salaries is earned in New York City and pay only New York State personal income tax. [sic] All spending from income earned in New York City by visiting team players happens outside of the City and State.
The December memo revises the estimate without providing a figure:
A portion of the visiting team players’ salaries is earned in Brooklyn and only New York State personal income tax is paid on such amount. All spending from income earned in New York City by visiting team players happens outside of the City and State.
(What percentage might that be? There would be 28 NBA teams based outside New York State, if the Nets move to Brooklyn from New Jersey. That suggests that the portion of salaries earned in Brooklyn, which of course does not collect its own taxes, would be 1/28, or less than 4%.)
 Consumption spending
There's a distinct difference between earned income and post-tax disposable income, but the ESDC seems to have discovered that only since October.
The October memo states:
Taxable consumption expenditures are assumed to be 40% of earned income. Sales tax rate is 8.375% (both State and City Sales Tax is 4% and an additional 0.375% collected for the MTA).
The December memo makes a switch:
Taxable consumption expenditures are assumed to be 40% of disposable income. Sales tax rate is 8.375% (both State and City Sales Tax is 4% and an additional 0.375% collected for the MTA).
The reason for the change is not explained. Neither the effect of the switch on the revenue calculations.
What happened to arena jobs?
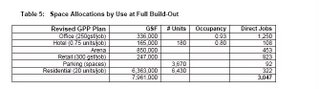 It's understandable that the number of jobs would go down, but there are fewer parallels between the memos than might be expected.
The October version estimates 3639 direct jobs, including 17 at the Urban Room, but ignores all jobs at the arena. The December memo estimates 3047 jobs, with 453 at the arena, but ignores the Urban Room. The ESDC offers no explanation for the changes. Did they just forget about the arena the first time?
What else is missing
Neither memo mentions the subsidies and tax exemptions that the ESDC has acknowledged in its calculations of net fiscal impact. The GPP issued in July (and subject of the October memo) assumes a public contribution of $545.5 million. The GPP issued December 8 (and subject of the most recent memo) assumes a public contribution of $453.4 million. In neither case, however, are those costs delineated.
Why did the public contribution go down? It's not explained, but a smaller project may lead to lesser sales and mortgage recording tax exemptions.
And the ESDC’s analysis has never included a significant number of other public costs and subsidies, including for affordable housing, schools, sanitation, and public safety.
The questions remain.
Notably, the memo does not explain why the agency changed its methodology in projecting a more than fivefold leap in city tax revenues from construction (even as the total tax revenue plummeted) nor a significant discrepancy between the revenues in the memo and in the General Project Plan (GPP).
Also, it doesn't explain why the ESDC changed the discount rate--the interest rate used in calculating the present value of expected benefits and costs—from 6% to 3%. (Given that a higher discount rate means a smaller present value of future cash flows, lowering the discount rate would increase the present value, perhaps overinflating even the lowered revenue figures the ESDC released this week.)
 Nor does the memo explain why the ESDC corrected some apparent errors in the previous memo, issued October 18, including an agency assertion that “25% of visiting team players salaries is earned in New York City.” (There are 30 teams in the National Basketball Association.)
[Note: the first graphic of each pair is from the October memo; the second graphic is from the December memo. Click to enlarge. Emphases in text are added.]
Inadequate transparency
 I shared the document with Dan Steinberg, research analyst of Good Jobs New York, which monitors economic development subsidies. He called it “a flimsy, last-minute attempt to address the transparency concerns that have been raised by the public and many elected officials. I’ve always had trouble getting information out of ESDC in this administration. We still don’t really understand where many of these numbers come from."
Similar, but different
The memo mirrors the document issued 10/18/06 in response to pressure from the press, politicians, and community members. The new memo reflects an 8% reduction in the square footage of the project, including a 44.5% cut in office space.
 Little is changed in the initial part of the memo, though Table 1, which describes the Atlantic Yards Revised GPP Plan (Residential Mixed-Use version) neglects, unlike in the October memo, to include an alternative plan with more office space.
(Why not? More office space would accommodate more jobs and return more taxes to the city and state. Does the ESDC no longer consider the alternate plan realistic? Or would the contrast in revenues--because office space generates more spinoff jobs and thus tax receipts--be even more dramatic?)
Construction impacts confusing
However, there are dramatic differences between the two versions of Table 2, which presents the estimated one-time construction economic and fiscal impacts of the overall project.
The new memo estimates 12,568 direct jobs—actually job-years—down from 15,344 in the October memo. There’s no explanation, however, about the reason for the 18% drop, which is not commensurate with the 8% reduction in the project’s size.
 More confusingly, the ESDC in the memo estimates $291.9 million in city tax revenues, a distinct contrast with the $52.5 million figure in the October version. The latest memo adds that “the New York City tax revenue total from construction activity is inclusive of the MTA portion of tax revenues,” but it doesn’t explain how that changes the calculation. By contrast, the newly revised General Project Plan states that construction employment will generate $42.1 million in city tax revenues, which sounds like a commensurate reduction from the October figure.
The October memo states:
Total personal income earned by direct, indirect, and induced construction-related wage earners is estimated to be $1.1 billion in New York City and $1.5 billion in New York State (inclusive of New York City). Tax revenue collected by New York City as a result of construction-related activity and employment is estimated to be $50.5 million and $109.5 million for New York State.
The December memo states:
Total personal income earned by direct, indirect, and induced construction-related wage earners is estimated to be $903 million in New York City and $1.2 billion in New York State (inclusive of New York City). Tax revenue collected by New York City as a result of construction-related activity and employment is estimated to be $291.9 million and $169.4 million for New York State.
 Steinberg observed, "The fact that there are discrepancies between this and the GPP (right; item iii) makes it difficult to understand what they’re saying at all.”
Impact from permanent jobs
In Table 3, the agency in the December memo estimates tax revenues from permanent jobs at the project. Again, the memo presents only the residential mixed-use version, rather than the alternative plan, with more office space.
 In the October memo, by contrast, the agency presents both versions, with the alternative plan estimated to provide more than double the tax revenues.
Given the significant decline in projected tax revenues, the contrast between the two versions would be even more glaring. Again, the ESDC changed from a 6% discount rate to a 3% discount rate, which could boost estimated revenue, without explaining why.
Summary of assumptions
The ESDC explains that it has used the REMI model (Regional Economic Models, Inc.) of the New York City region: “REMI tax revenue estimates reported here reflect a broad set of state and local tax collections including personal income tax, corporate and business income tax, sales tax, property tax, and miscellaneous other taxes.”
 Confoundingly, both versions of the memo, which skips from Table 3 to Table 5, neglect to explain where in the model the ESDC factors in taxes on” taxable ticket, concessions, and novelties sales at the arena” and effects from the players’ earnings and consumption spending.
Player salaries
The ESDC assumes, as did Forest City Ratner consultant Andrew Zimbalist, that “30% of Nets players live in New York City and pay both City and State personal income tax.” Still, it’s not clear whether that's a realistic assumption.
The October memo states:
25% of visiting team players’ salaries is earned in New York City and pay only New York State personal income tax. [sic] All spending from income earned in New York City by visiting team players happens outside of the City and State.
The December memo revises the estimate without providing a figure:
A portion of the visiting team players’ salaries is earned in Brooklyn and only New York State personal income tax is paid on such amount. All spending from income earned in New York City by visiting team players happens outside of the City and State.
(What percentage might that be? There would be 28 NBA teams based outside New York State, if the Nets move to Brooklyn from New Jersey. That suggests that the portion of salaries earned in Brooklyn, which of course does not collect its own taxes, would be 1/28, or less than 4%.)
 Consumption spending
There's a distinct difference between earned income and post-tax disposable income, but the ESDC seems to have discovered that only since October.
The October memo states:
Taxable consumption expenditures are assumed to be 40% of earned income. Sales tax rate is 8.375% (both State and City Sales Tax is 4% and an additional 0.375% collected for the MTA).
The December memo makes a switch:
Taxable consumption expenditures are assumed to be 40% of disposable income. Sales tax rate is 8.375% (both State and City Sales Tax is 4% and an additional 0.375% collected for the MTA).
The reason for the change is not explained. Neither the effect of the switch on the revenue calculations.
What happened to arena jobs?
 It's understandable that the number of jobs would go down, but there are fewer parallels between the memos than might be expected.
The October version estimates 3639 direct jobs, including 17 at the Urban Room, but ignores all jobs at the arena. The December memo estimates 3047 jobs, with 453 at the arena, but ignores the Urban Room. The ESDC offers no explanation for the changes. Did they just forget about the arena the first time?
What else is missing
Neither memo mentions the subsidies and tax exemptions that the ESDC has acknowledged in its calculations of net fiscal impact. The GPP issued in July (and subject of the October memo) assumes a public contribution of $545.5 million. The GPP issued December 8 (and subject of the most recent memo) assumes a public contribution of $453.4 million. In neither case, however, are those costs delineated.
Why did the public contribution go down? It's not explained, but a smaller project may lead to lesser sales and mortgage recording tax exemptions.
And the ESDC’s analysis has never included a significant number of other public costs and subsidies, including for affordable housing, schools, sanitation, and public safety.
The questions remain.
Comments
Post a Comment