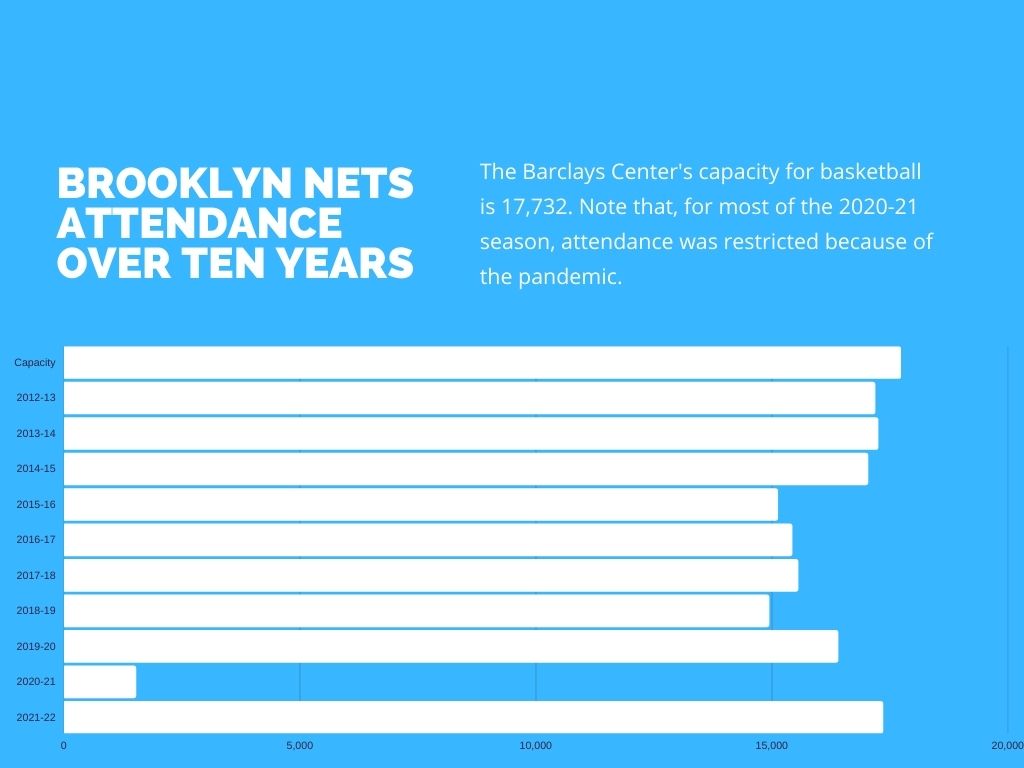
At Barclays Center over ten years, (relative) boom-and-bust Nets attendance, now rising as team improves. Gate count always trails official figures.
After ten years, let's look back at the Brooklyn Nets' announced regular-season attendance at the Barclays Center, which started with a relative bang (#16 in the 30-team league, after ranking last in New Jersey), then retreated after the team lost stars and had trouble competing, then began to rebound with new stars--well, one who played--in 2019, and last year came back more (#13).
 |
| Logo from Twitter |
For example, while the Nets were ranked 16th in attendance in their debut season, 2021-13, they would've ranked 12th in percentage full. Similarly, last season, while they were ranked 13th in attendance, they would've ranked 9th in percentage full.
Though the Nets recently faced much off-season drama--would Kyrie Irving stay? would Kevin Durant rescind (reported) requests for a trade and to fire the coach/GM? would Ben Simmons' return to full capacities?--that seems to have subsided.
Assuming the roster, with some strategic additions, is at full-strength--not a guarantee--the team should compete for the conference lead and offer some good entertainment, all of which should sell seats and help pay for some hefty salaries.
Also note that, in relation to the arena's lagging revenues/profits and below-projections event count, as I wrote in the past two days, a long Nets playoff run really helps. ESPN does not rank playoff attendance, which is typically close to a sellout, if not a full one.
Attendance vs. gate count
As I wrote in August 2016, while the Nets officially averaged 17,187 in the debut season, 2012-13; 17,251 in 2013-14; 17,037 in 2014-15; and 15,125 in 2015-16, those numbers didn't reflect people in the seats.
A report on traffic by Empire State Development, the New York state agency that oversees/shepherds the arena and larger project, stated, "Actual attendance during the 2012-2013 season (including Playoffs) averaged approximately 14,974." That's a significant drop from 17,187.
Similarly, according to a report to potential bond buyers from consultant Conventions Sport & Leisure, the Nets averaged approximately 14,900 fans per game over the first three years, or 13.2% less than announced.
Freebies do continue. As I wrote 10/31/21, the Nets' reasonably solid attendance figures over their first four home games last season, 16,522, or 93.2% of capacity, deserve a small asterisk: 1,000 of those tickets distributed are giveaways, thanks to uniform patch sponsor Webull.
Annual rankings
The rankings linked below are by ESPN and Basketball Reference. ESPN unfortunately does not calculate changes in ticket prices, which also would be helpful to analyze.
The numbers start with the team's rank in the league, average reported attendance, and percentage capacity, all from ESPN, then the team's record, from Basketball Reference. I've added a few notes about the team, but haven't tried to be comprehensive.
#30 / 13,961 / 75.5% / 22-44
2012-13 (Barclays Center debut, with Joe Johnson joining Deron Williams)
#16 / 17,187 / 94.9% / 49-33
#16 / 17,187 / 94.9% / 49-33
2013-14 (with Kevin Garnett and Paul Pierce, aging stars from Boston Celtics)
#17 / 17,251 / 95.3% / 44-38
2014-15 (without Pierce; Garnett traded in February 2015)
#20 / 17,037 / 94.1% / 38-44
2015-16 (without Williams; Sean Marks hired as GM in February 2016; Johnson waived that month; three-year season-ticket plans had expired)
#17 / 17,251 / 95.3% / 44-38
2014-15 (without Pierce; Garnett traded in February 2015)
#20 / 17,037 / 94.1% / 38-44
2015-16 (without Williams; Sean Marks hired as GM in February 2016; Johnson waived that month; three-year season-ticket plans had expired)
#27 / 15,125 / 83.6% / 21-61
2016-17 (Kenny Atkinson debuts as coach)
#28 / 15,429 / 85.2% / 20-62
2017-18 (Spencer Dinwiddie, Caris LeVert, DeAngelo Russell, Joe Harris show promise)
#29 / 15,556 / 87.7% / 28-54
2016-17 (Kenny Atkinson debuts as coach)
#28 / 15,429 / 85.2% / 20-62
2017-18 (Spencer Dinwiddie, Caris LeVert, DeAngelo Russell, Joe Harris show promise)
#29 / 15,556 / 87.7% / 28-54
2018-19 (Jarrett Allen helps team core)
#30 / 14,941 / 84.3% / 42-40
2019-20 ("Clean sweep" brings stars Irving and Durant, plus DeAndre Jordan, though Durant is rehabbing from injury and team loses budding stars; pandemic truncates season)
2019-20 ("Clean sweep" brings stars Irving and Durant, plus DeAndre Jordan, though Durant is rehabbing from injury and team loses budding stars; pandemic truncates season)
#24 / 16,403 / 92.5% / 35-37
2020-21 (pandemic limits attendance league-wide; Durant back; Steve Nash hired as Nets coach; team loses squeaker in second round of playoffs against Milwaukee Bucks)
#24 / 1,524 / 8.6% / 48-24
2020-21 (pandemic limits attendance league-wide; Durant back; Steve Nash hired as Nets coach; team loses squeaker in second round of playoffs against Milwaukee Bucks)
#24 / 1,524 / 8.6% / 48-24
2021-22 (Irving misses many games because he's unvaccinated; Harris injured; Nets trade Harden for injured Simmons; team swept in first round of playoffs by Boston Celtics)
#13 / 17,354 / 97.9% / 44-38
Comments
Post a Comment