ANHD risk chart shows four Community Districts near Atlantic Yards face high rent burdens, while few truly affordable units have been built.
The Association for Neighborhood & Housing Development (ANHD) has released its 2025 Housing Risk Chart, How is Affordable Housing Threatened in Your Neighborhood.
(The ANHD is a membership organization of New York City neighborhood-based community groups, community development corporations (CDCs), affordable housing developers, supportive housing providers, community organizers, and economic development providers.)
I've highlighted the sections involving the four Community Districts in Brooklyn--CDs 2, 3, 6, and 8--in the orbit of the Atlantic Yards/Pacific Park project and in which local residents get a preference in affordable housing lotteries, at least for city-sponsored units (as opposed to those solely relying on a state tax break).

CD's 3 and 8 are also the location of the sites in the Atlantic Avenue Mixed-Use Plan.

The chart, according to the ANHD, highlights and ranks 18 indicators of demographics and housing risk to inform targeted, neighborhood-level action.
The chart uses color coding to highlight the highest levels of risk: when a value is orange, it means that Community District ranks in the top ten citywide for that risk. When it’s yellow, it ranks in the top twenty.
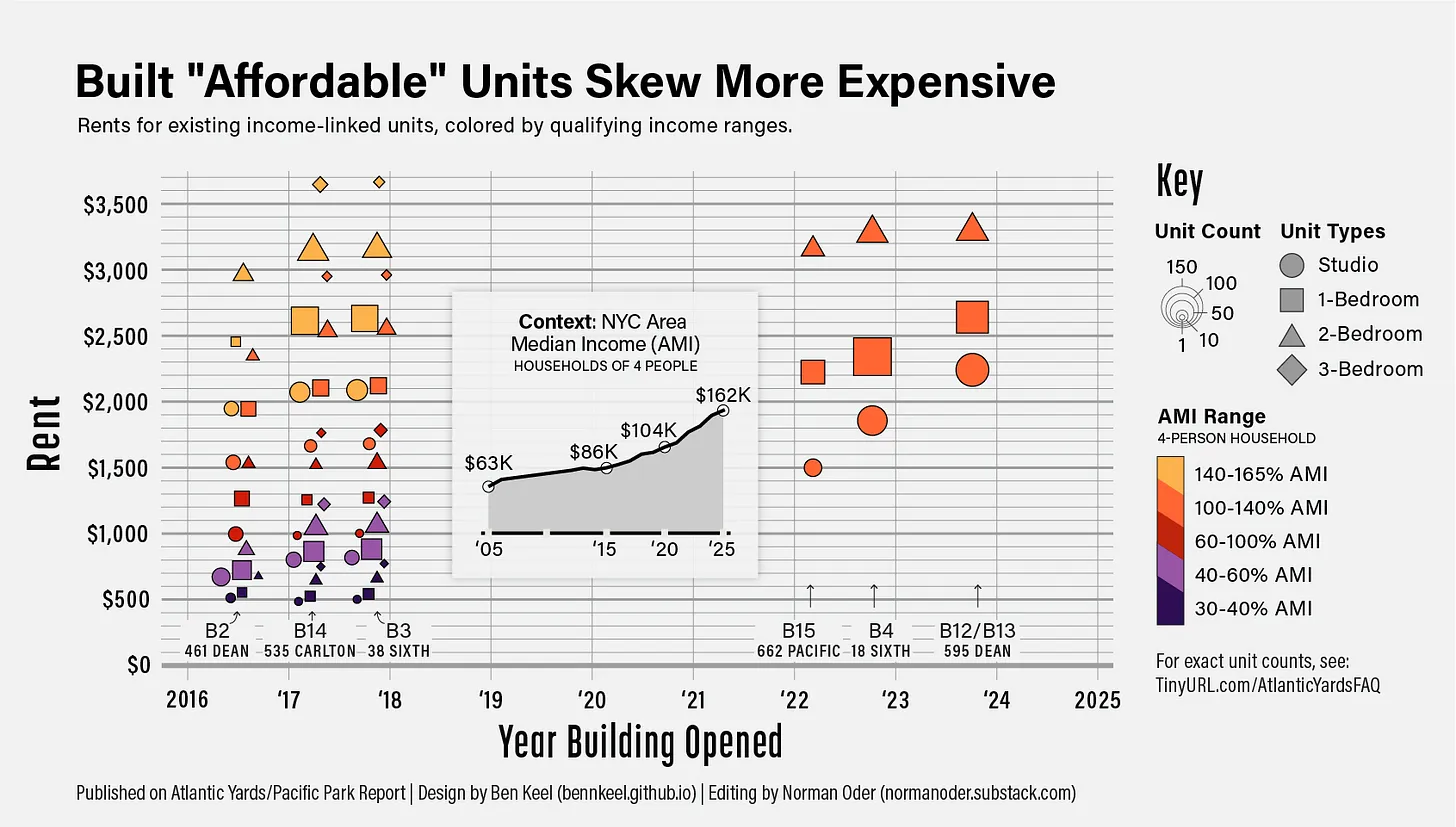

Chart goals

The chart, according to the ANHD, highlights and ranks 18 indicators of demographics and housing risk to inform targeted, neighborhood-level action.
The chart uses color coding to highlight the highest levels of risk: when a value is orange, it means that Community District ranks in the top ten citywide for that risk. When it’s yellow, it ranks in the top twenty.
The last column, the Threats to Affordable Housing Score, tallies up an overall risk score to identify the Top 10, Top 20, and Top 30 most at risk districts, by assigning districts two points for each indicator that ranks in the top ten and one point for each indicator that ranks in the top twenty.
The Bronx > Brooklyn
The Bronx > Brooklyn
It's worth noting that, despite the significant stresses around the city and in some of the areas near Atlantic Yards/Pacific Park, CD 2, with 9 points, and CD 3, with 8 points, are the only two of the four nearby Community Districts that rank in the top 30, while CD 6 and CD 8 don't even rank.
Part of that is because, as seen in the excerpt from the chart above, the Bronx is in so much worse shape, facing extremely high rent burdens, eviction filings, and housing violations, while having some of the lowest incomes and highest shares of residents of color.
Part of that is because, as seen in the excerpt from the chart above, the Bronx is in so much worse shape, facing extremely high rent burdens, eviction filings, and housing violations, while having some of the lowest incomes and highest shares of residents of color.
While ANHD typically includes a percentage of those rent-burdened, spending more than 30% of their income on rent. this year it added Percent with Severe Rent Burden, "the share of households that are spending over half their income on rent, a critical measure of housing precarity," again focused on the Bronx.
Still, risks are high
Nonetheless, if you look at the rectangle highlighted in red, the Percent with Rent Burden and Percent with Severe Rent Burden for the four Brooklyn Community Districts was:
- CD 2: 40.1%; 19.9%
- CD 3: 50.9%; 26.7%
- CD 6: 34.8%; 14.4%
- CD 8: 46.9%; 23.4%
Those percentages are particularly high in Community Districts 3 and 8, covering Bedford-Stuyvesant and Crown Heights/Prospect Heights.
"Development Without Affordability"
ANHD last year started breaking out the number of new housing units into two categories: Number of New Over 80% AMI & Market Rate Units and Number of New Units at or Below 80% AMI.
The 80% AMI figure is the boundary for "low-income" units, but even they can be pretty pricey, with a studio in 2025 facing a rent ceiling of $2,268 and a 1-BR facing a ceiling of $2,430.
"This distinction helps us better understand which income groups are being served by new development," ANHD states, noting that in 2024 there were 13,281 market-rate/over 80% AMI units vs. only 2,153 affordable units below 80% AMI.
"This citywide imbalance reveals a troubling trend: new housing is being built – but not for those who need it most," ANHD states. "Affordability is being left out of the growth story in community after community."
The numbers of 80% AMI and above units and those below 80% AMI in the four Brooklyn Community Districts was:
- CD 2: 1,711; 63
- CD 3: 733; 503
- CD 6: 389; 28
- CD 8: 590; 66
I don't think the CD 8 figures include any Atlantic Yards/Pacific Park units, but in 2023 the 595 Dean Street towers opened, with 798 apartments, among them 240 income-targeted units, albeit at 130% of Area Median Income.
Comments
Post a Comment