Pollstar stats on concert attendance show Barclays Center opened with a bang, then retreated. Effort to rebuild busier schedule reversed by COVID.

Now let's look at statistics regarding concerts, using rankings for tickets sold (and, later, adding ticket revenue) from the industry source Pollstar.
Sure, those are not the only non-NBA events--of course there are other sports and family shows--but are another significant metric.
I've also cited statistics for other arenas in the tri-state area. Notably,
Barclays was fortunate to start with a bang, while rival Madison Square Garden was under renovation, with a big first three months at the end of 2012.
So, after (micro-owner of the Brooklyn Nets and icon) Jay-Z sold out eight shows, the arena also hosted Brooklyn-born diva Barbra Streisand, teeny-bopper fave Justin Bieber; and the Rolling Stones. Barclays, bookers told the New York Times, by then vied with MSG, with its crowded calendar and tougher terms. A musical act might earn $250,000 more in Brooklyn, despite similar ticket prices.
"The true test," promoter Jim Glancy wisely observed, "is years away," given that Barclays' honeymoon overlapped with renovations at MSG. Indeed, the latter has rebounded solidly, and reaps more money per ticket (but may have higher costs). Perhaps crucially, MSG also has space for a second venue, Hulu Theater, for smaller acts, below the main venue.
That better deal at Barclays may not have been sustainable, given that a busy schedule for the Brooklyn arena did not translate into profits. (More on that in another article.)
The advent of the New York Islanders in Fall 2015 helped cut into the concert schedule, while their partial (and then full) departure opened up some space. But COVID hammered large venues. Now, given that some tours haven't resumed or have postponed events, the short-term future is cloudy.

Spinning statistics
"After Just Two Years, Barclays Center Continues To Be a Top-Ranked Venue Worldwide," a January 2015 press release from the arena claimed, citing gross revenue, not net. Though the arena reaped big numbers, that did not mean profits, as net revenues were way behind predictions.
And the concert schedule would subside. Though arena CEO Brett Yormark once predicted “25-plus” major college basketball games, college hoops averaged 22 games a year, with some 5,000 fans. Despite projecting 12 fight cards annually, Barclays averaged half that. Family shows also fell short.
2012 results
It's notable that, in little over three months --the arena opened Sept. 28, 2012 with eight concerts from Jay-Z--Barclays sold 356,512 tickets. Extrapolated out over 12 months would've been a monster year.
16. Madison Square Garden, 453,894
23. Prudential Center, 402,313
23. Madison Square Garden, 475,380
40. Prudential Center, 377,942


Also note Billboard's 10/2/18 12-month totals:
2. MSG; Concert Capacity: 19,301; 12-month gross: $158.6M
5. Barclays Center; Concert Capacity: 19,000; 12-month gross: $80.52M
Also note Billboard's 9/30/19 12-month totals:
1. MSG; Concert Capacity: 20,967
12-month gross: $173.5M
Barclays was not in the listed top ten; #10 had a 12-month gross of $55.3M. Barclays may--I don't have the statistics--have made it to the top ten for the calendar year.


17. Prudential Center, 144,803 ($10.1M)

It's notable that, in little over three months --the arena opened Sept. 28, 2012 with eight concerts from Jay-Z--Barclays sold 356,512 tickets. Extrapolated out over 12 months would've been a monster year.
16. Madison Square Garden, 453,894
23. Prudential Center, 402,313
32. Barclays Center, 356,512
(I don't have statistics for the Izod Center and Nassau Coliseum.)
 |
| Screenshots from Pollstar |
2013 results
While Barclays was the leading arena in the United States, its totals were less than three times the total during three-plus months in 2012.
3. Barclays Center, 991,75223. Madison Square Garden, 475,380
40. Prudential Center, 377,942
59. Izod Center, 251,805
68. Nassau Coliseum, 231,486

4. Madison Square Garden, 793,395

2014 results
By then, the concert schedule had subsided, and MSG was back.
6. Barclays Center, 723,616
27. Prudential Center, 449,203
43. Izod Center, 374,820
136. Nassau Coliseum, 93,907
27. Prudential Center, 449,203
43. Izod Center, 374,820
136. Nassau Coliseum, 93,907

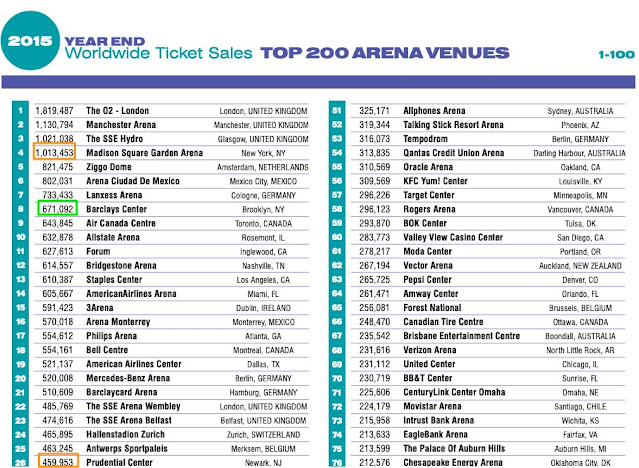
2015 results
In the fall, the New York Islanders began to play, cutting into potential concert dates.
4. Madison Square Garden, 1,013,453
8. Barclays Center, 671,092
26. Prudential Center, 459,953
26. Prudential Center, 459,953
Izod Center closed 1/15/15. The Nassau Coliseum, not on the list, closed in August for renovation.

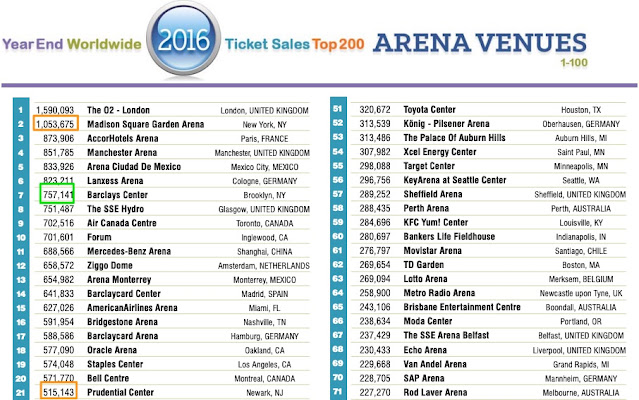
2016 results
A slight improvement over 2015.
2. Madison Square Garden, 1,053,675
7. Barclays Center, 757,141
21. Prudential Center, 515,143
21. Prudential Center, 515,143

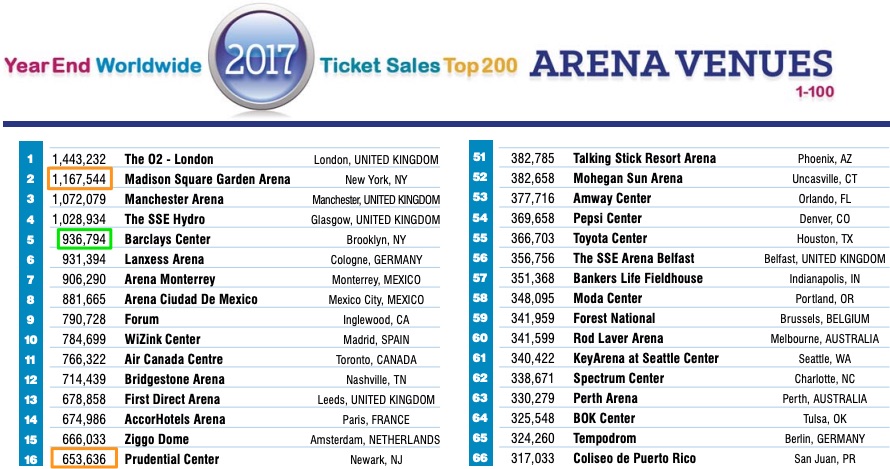
2017 results
A much bigger year for Barclays.
2. Madison Square Garden, 1,167,544
7. Barclays Center, 936,794
16. Prudential Center, 656,636
16. Prudential Center, 656,636
42. NYCB Live Nassau Veterans Memorial Coliseum (which reopened), 437,993
2018 results
Even though the Islanders began part-time at the Nassau Coliseum, another step back for Barclays.
1. Madison Square Garden, 1,155,480
8. Barclays Center, 816,980
18. Prudential Center, 682,474
18. Prudential Center, 682,474
31. NYCB Live Nassau Veterans Memorial Coliseum, 490,380

2. MSG; Concert Capacity: 19,301; 12-month gross: $158.6M
5. Barclays Center; Concert Capacity: 19,000; 12-month gross: $80.52M
2019 results
A consistent year for Barclays, though note how its revenue per ticket was dwarfed by MSG.
1. Madison Square Garden, 1,651,229 ($201.5M)
11. Barclays Center, 823,375 ($73.1M)
26. Prudential Center, 645,941 ($52.5M)
59. NYCB Live Nassau Veterans Memorial Coliseum, 358,325 ($25.1M)

1. MSG; Concert Capacity: 20,967
12-month gross: $173.5M
Barclays was not in the listed top ten; #10 had a 12-month gross of $55.3M. Barclays may--I don't have the statistics--have made it to the top ten for the calendar year.
2020 results
A solid start for Barclays, truncated by the pandemic.
3. Madison Square Garden, 394,354 ($49M)
5. Barclays Center, 344,456 ($28.8M)
15. Prudential Center, 248,304 ($19.6M)
28. NYCB Live Nassau Veterans Memorial Coliseum, 182,161 ($11.2M)

2021 results
A slow year for all, given the pandemic.
2. Madison Square Garden, 298,235 ($38.4M)
26. Barclays Center, 120,719 ($9.3M)
74. Prudential Center, 40,515 ($4M)
The Nassau Coliseum had closed temporarily. UBS Arena in Elmont opened, but was not on the list.

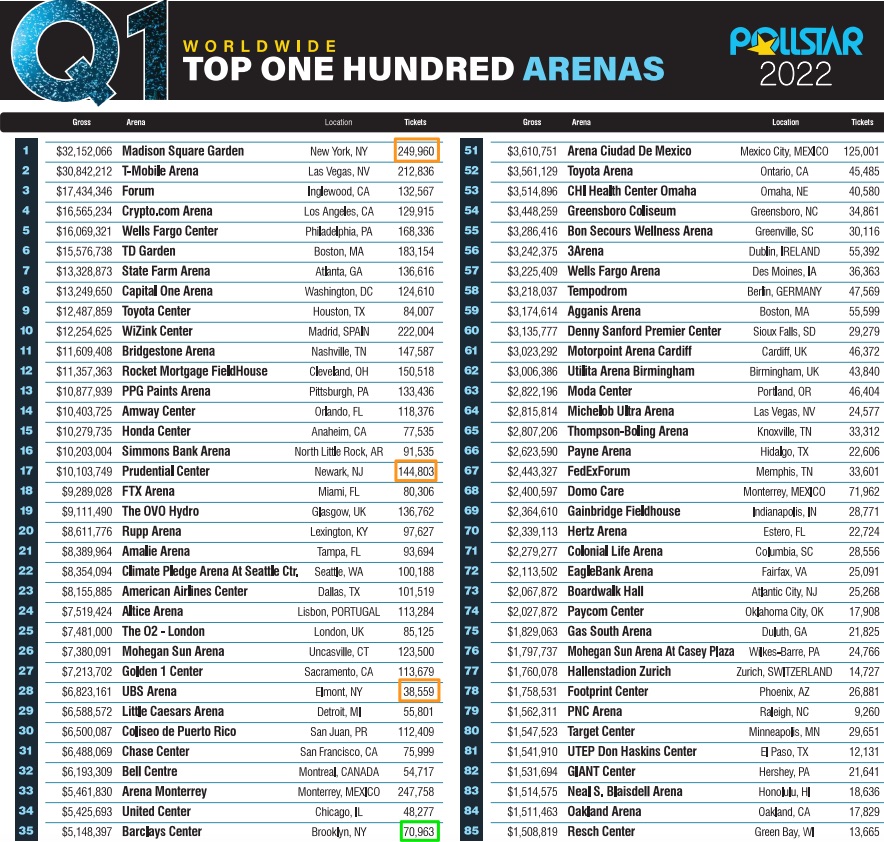
2022 Q1 results
A slow first quarter for Barclays. And while Brooklyn Nets games of course were competing with concert dates, MSG--which hosts two teams but also contains another venue--did far better. That said, one quarter does not represent a full year.
Unlike the previous, the rankings are by revenue, not ticket count.
2. Madison Square Garden, 249,960 ($32.2M)28. UBS Arena, 38,559 ($6.8M)
35. Barclays Center 70,963 ($5.1M)
35. Barclays Center 70,963 ($5.1M)
Comments
Post a Comment